


A new U.S. Geological Survey interactive map provides a searchable way to review water quality data collected by the USGS and 73 other organizations at almost 1,400 sites. The data captures nutrient, pesticide, salinity, sediment, fish populations, algae blooms and more. It maps quality trends of the nation’s rivers and streams over the last four decades.
Since the 1972 passage of the Clean Water Act, federal, state and local agencies have invested billions of dollars to reduce the amount of pollution entering rivers and streams, according to USGS. The agency’s position is tracking changes in water quality over multiple decades is crucial for evaluating the effectiveness of pollution control efforts and protecting the nation’s water resources in the future. USGS performs both regional and national scientific assessments and partners with numerous organizations monitoring water quality.
Specifically the map can be used to search if 51 water-quality constituents and 38 aquatic-life metrics -- like the types and numbers of fish, macroinvertebrates and algae -- have increased, decreased or remained the same.
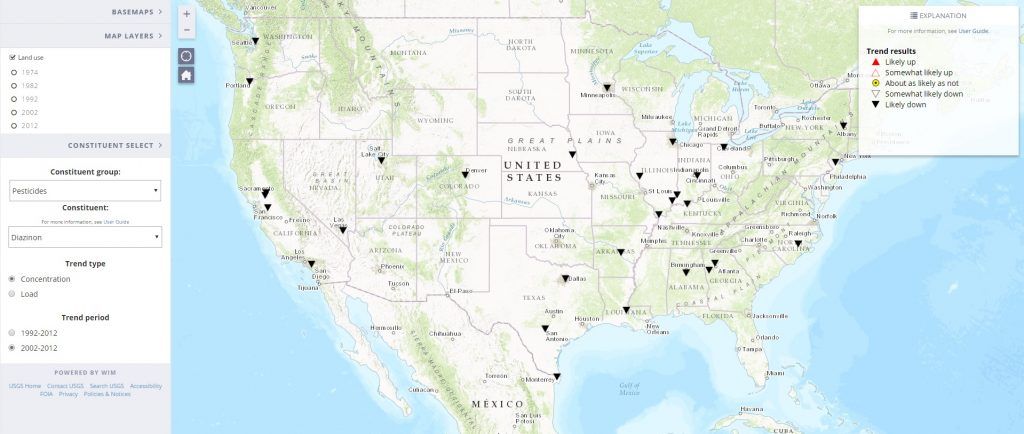
For example, USGS noted that the map shows how the phaseout of the pesticide diazinon for residential and some agricultural uses initiated in 2000 and led to widespread reductions in concentrations in U.S. streams in the trend period from 2002 to 2012:
On a more granular level, a trend can be viewed in terms of concentration -- the mass of a pollutant in a defined volume of water -- such as the concentration of diazinon in a section of New Jersey’s Delaware River called South Bound Brook. Or it can be viewed by load, which is the mass of a pollutant discharged into a water body during a period of time. An example of a load would be tons of sediment per year entering a stream.
The second phase of the project will factor where investments in pollution control have been effective, identify major causes of data trends and detail which chemicals are increasing or decreasing. The agency will also indicate any drinking water sources or aquatic ecosystems that are at increased risk.
Access the map on the USGS website.
Learn more about the project on the National Water-Quality Assessment Project website.
